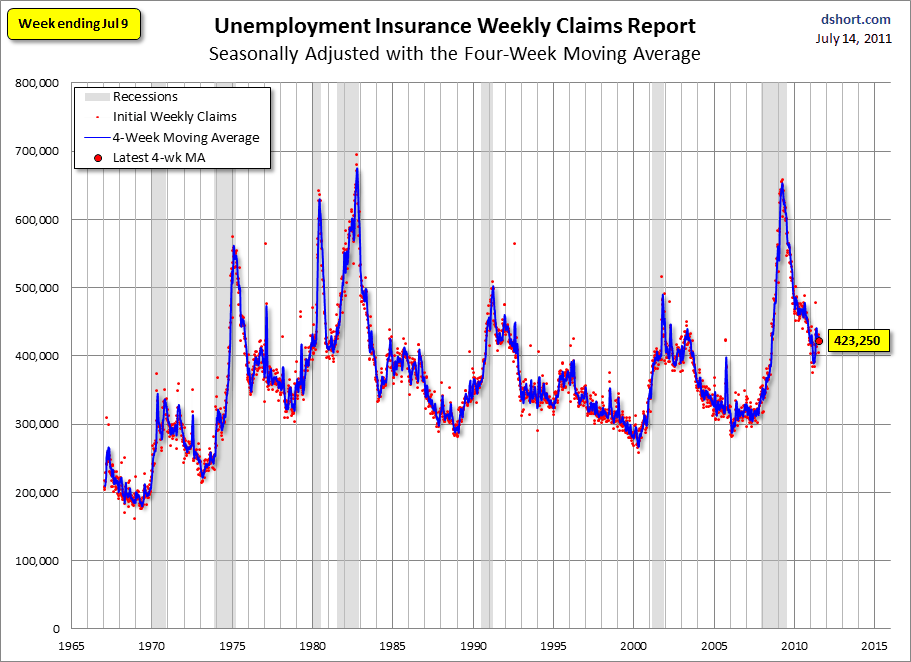
The Unemployment Insurance Weekly Claims Report was released this morning for last week. Claims dropped 22,000 from the previous week, which was revised upward by 9,000. The four-week moving average declined by 3,750. Despite the improvement, this marks the 14th week above the 400K level after dropping below 400K for seven of the previous nine weeks. Here is the official statement from the Department of Labor:
In the week ending July 9, the advance figure for seasonally adjusted initial claims was 405,000, a decrease of 22,000 from the previous week's revised figure of 427,000. The 4-week moving average was 423,250, a decrease of 3,750 from the previous week's revised average of 427,000.
The advance seasonally adjusted insured unemployment rate was 3.0 percent for the week ending July 2, unchanged from the prior week's revised rate of 3.0 percent.
The advance number for seasonally adjusted insured unemployment during the week ending July 2 was 3,727,000, an increase of 15,000 from the preceding week's revised level of 3,712,000. The 4-week moving average was 3,719,250, a increase of 6,250 from the preceding week's revised average of 3,713,000.
Today's seasonally adjusted number, 405K, was better than (below) the Briefing.com consensus estimate of 410K. As we can see, there's a good bit of volatility in this indicator, which is why the four-week moving average (shown in the callouts) is a more useful number than the weekly data.
[Click all to enlarge]
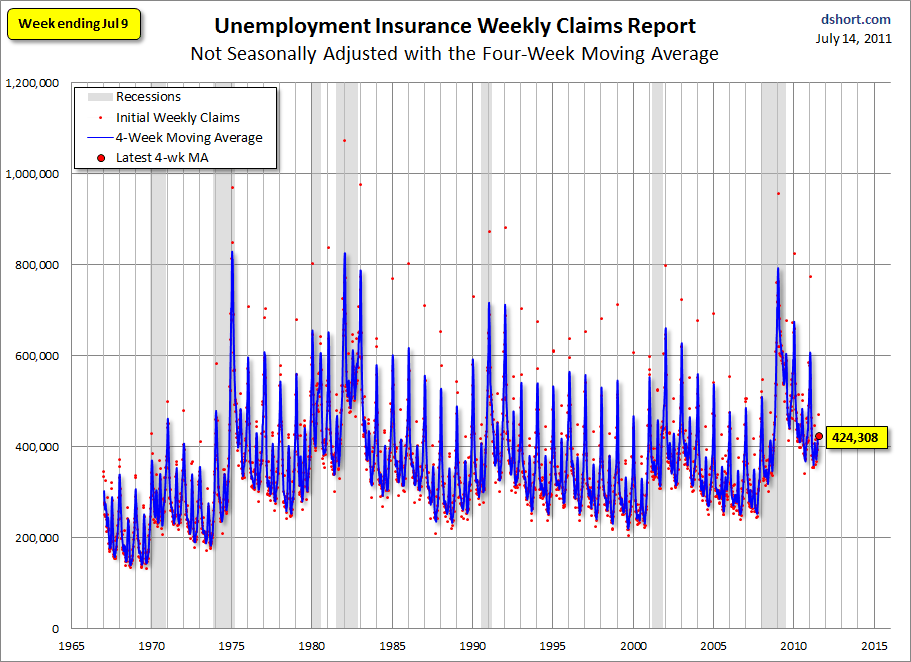
 Occasionally I see articles critical of seasonal adjustment, especially when the non-adjusted number better suits the author's bias. But a comparison of these two charts clearly shows extreme volatility of the non-adjusted data, and the four-week MA gives an indication of the recurring pattern of seasonal change in the second chart (note, for example, those regular January spikes).
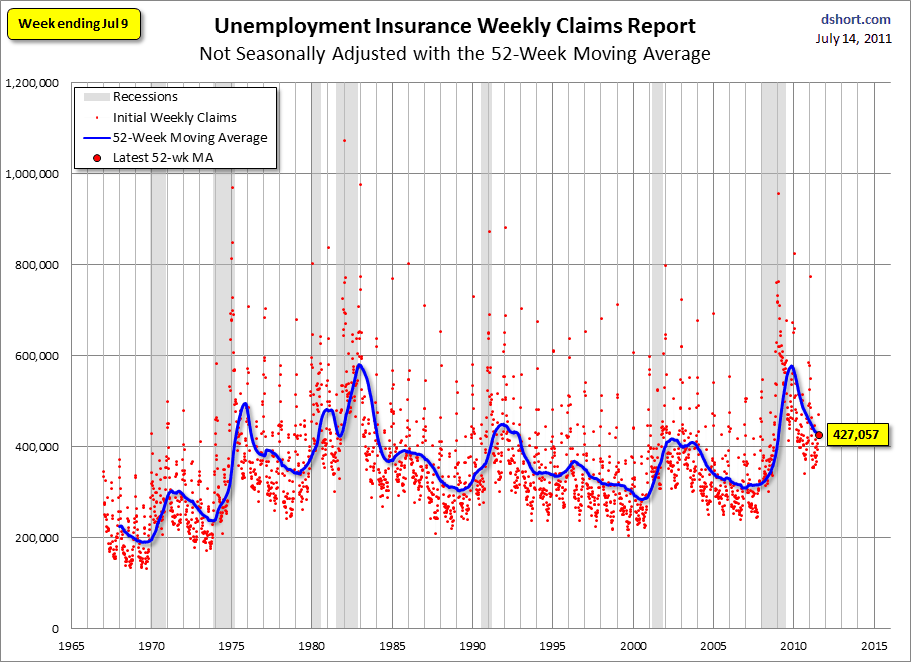
 Because of the extreme volatility of the non-adjusted weekly data, a 52-week moving average gives a better sense of the long-term trends.
 The Bureau of Labor Statistics provides an overview on seasonal adjustment here (scroll down about half way down). For more specific insight into the adjustment method, check out the BLS Seasonal Adjustment Files and Documentation. For a broader view of unemployment, see the latest update in my monthly series Unemployment and the Market Since 1948.
No comments:
Post a Comment